The paper, figure by figure
Every figure, table and code listing in the Lockstep paper, in the order they appear. For each one: what it shows, a short way to say it, how to read it, and the questions people usually ask about it.
Four ideas behind every chart
Each grid line is 10 times the one before (1, 10, 100, 1,000), so tiny and huge numbers fit on one chart. The distance between two dots shows how many times faster one is. One grid line apart means 10×, two means 100×.
Each program runs at 3 or 4 sizes. Plot CPU time against the amount of work and fit a straight line. The slope is the cost of one unit (one call, one loop iteration). Start-up costs, like SpecTec's 30-second spec load, fall into the line's starting point and drop out.
The fair average for ratios: multiply them, then take the root. 2× and 8× average to 4×, so "twice as fast" and "half as fast" cancel out instead of skewing the result.
Timings ran on a shared 4-core server that was busy with other jobs, so they can wobble. Test results and allocation counts don't depend on machine load, so they are exact.
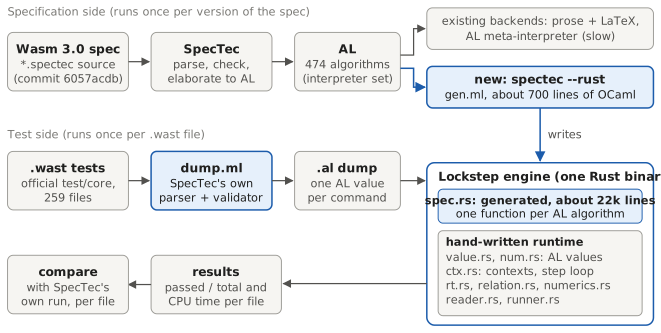
Figure 1. Architecture
The short version
At the top, the official WebAssembly spec goes into SpecTec, which turns it into 474 small algorithms. My compiler, the blue box, turns those algorithms into about 22,000 lines of Rust. In the middle, each official test file is turned into data the engine can read, using SpecTec's own parser, so both sides read the tests the same way. At the bottom, the results are compared with SpecTec's, file by file.
How to read it
- Top row, the specification side (runs once per version of the spec). The Wasm 3.0 spec source goes into SpecTec, which parses, checks and turns it into AL: 474 step-by-step algorithms, the same ones printed as numbered steps in the published standard. Before this project, AL could only become prose and LaTeX, or be run slowly by the meta-interpreter (the gray note). The blue box,
spectec --rust(gen.ml, about 700 lines of OCaml), is new: it writesspec.rs. - Middle row, the test side (runs once per test file). The 259 official
.wastfiles go throughdump.ml, which uses SpecTec's own parser and validator and writes one AL value per test command. - The big box, the Lockstep engine, is one Rust program with two halves:
spec.rs, generated, one function per algorithm, and a hand-written runtime (values, the context stack and step loop, number math, the test reader and runner). - On the right, the engine reports passed / total and CPU time for each file, and that is compared with SpecTec's own run of the same file.
Common questions
Which parts did you write?
The blue ones: the compiler gen.ml, the test dumper dump.ml and the engine's runtime. spec.rs is written by the compiler, not by hand.
Isn't the hand-written runtime cheating?
No. It has no rules for any instruction. It's the same kind of support code that SpecTec's own meta-interpreter writes by hand in OCaml: the context stack, the step loop, number math. About 4,900 lines, none of it specific to one instruction. Every instruction's behaviour comes from the spec.
Why reuse SpecTec's parser?
Parsing and validating test files aren't part of the spec's execution algorithms. The meta-interpreter reuses the same code, so both sides read the tests identically and the comparison is fair. Everything after that (instantiating modules, calling functions, executing) runs in the generated code.
What happens when the spec changes?
Run the compiler again and spec.rs is regenerated. The runtime only needs work if a change adds a new kind of statement or a new built-in function.
Table 1. How Lockstep differs from previous approaches
| Approach | Source of the semantics | How programs run | Follows the official spec automatically |
|---|---|---|---|
| SpecTec meta-interpreter, SpecTecX | SpecTec source | interprets the spec | yes |
| WasmCert, WasmRef-Isabelle, progressful interpreters | separate Coq/Isabelle formalization | verified interpreter | no (manual updates) |
| KWasm, compiling by proving | separate K semantics | K rewriting | no (manual updates) |
| Reference interpreter, Wasmtime, wasmi, wasm3 | hand translation of the standard | native code | no (manual updates) |
| Lockstep (this work) | official SpecTec source | compiled AL (Rust) | yes |
The short version
The key column is the last one: does it follow the official spec automatically? Hand-written engines and separate formal versions all need someone to update them by hand when the spec changes. Only SpecTec's own interpreter and Lockstep follow the spec automatically, and Lockstep compiles it instead of interpreting it, so it's much faster.
How to read it
- Each row is a family of projects. The columns say where each one gets the meaning of the instructions, how it runs programs, and whether it updates itself when the standard changes.
- Rows 2 and 3 are serious, even mathematically verified, but they re-write Wasm separately in another formal language. When the standard changes, people update them by hand.
- Row 4 is the engines people actually use, plus the official reference interpreter. All hand translations: fast, but they can drift from the spec.
- Only rows 1 and 5 say yes. The difference between them is the middle column: row 1 interprets the spec, Lockstep compiles it.
Common questions
Why not just use Wasmtime? It's much faster.
Wasmtime is a hand translation of the spec, so it can disagree with it. Lockstep agrees with the spec by construction, so it can be the trusted reference you test engines like Wasmtime against.
Why does speed matter for a reference?
Differential fuzzing: run huge numbers of random programs on an engine and on a trusted reference, and compare. Wasmtime's developers stopped fuzzing against the OCaml reference interpreter because it was too slow and switched to WasmRef-Isabelle. A reference has to be fast to be used this way.
Table 2. How each AL statement becomes Rust
| AL statement | Generated Rust |
|---|---|
Assert e | if !is_true(e) { return err(..) } |
Let p = e | evaluate e, then pattern-match it against p, binding variables |
Pop p, Pop val^n, Pop_all val* | cx.pop_value(), cx.pop_values(n), cx.pop_all(), then match against the pattern |
Push e | cx.push(e) |
If / Else, Either | if / else; for Either, try the first branch and run the second if it fails |
Enter (ctx, instr* ++ [M]) { body } | cx.push_context(ctx, ..), then the body |
Exit K | cx.pop_context() |
Execute instr, Execute instr* | cx.execute(i), cx.execute_seq(is); if not last, followed by cx.run(depth) |
Trap, Return e | return Err(Exn::Trap), return Ok(Some(e)) |
e[i] := v, e.F := v, e :+ v | rt::replace_idx, rt::replace_dot, rt::append (in place) |
The short version
This table is basically the whole compiler. The spec's algorithms use only about ten kinds of statement, like Assert, Pop, Push, If and Trap, and each kind is always translated the same way. That's why the compiler is only about 700 lines, and why nothing is special-cased for a single instruction.
How to read it
- Left: a kind of statement in the spec's algorithms. Right: the Rust the compiler prints for it.
Assert: check a condition, stop with an error if it's false.Pop/Push: take a value off the stack / put one on.Enter/Exit: start / finish a block.Execute: run an instruction.Trap: stop the Wasm program with an error, like dividing by zero.- The last row: change something in place, like a memory or a local variable.
Common questions
Which rule was the tricky one?
Execute (or Enter) when it's not the last statement. The spec expects everything it starts to finish before the next line runs. The meta-interpreter gets that from its step counter. The generated code remembers the stack depth and runs until it's back there: cx.run(depth).
Where does the speed come from, if it's the same statements?
From deciding things ahead of time. At every step the meta-interpreter looks up the algorithm by name, stores variables in a lookup table and matches patterns at run time. The compiled code makes direct function calls, uses plain Rust variables, has the pattern checks written out, and turns names into small number tags. That alone gives the 28× of version v0.
Listing 1. br_if: the spec's algorithm and its Rust
Step_pure/br_if l {
 Assert (top_value(I32))
 Pop (I32.CONST c)
 If ((c =/= 0)) { Execute (BR l) }
 Else { Nop }
}
spec.rs)pub fn r_BR_IF(cx: &mut Cx, args: &[Value]) -> Res<Option<Value>> {
let mut v_c: Value = Value::Bool(false);
let mut v_l: Value = Value::Bool(false);
if args.len() != 1 { return err(format!("Expected 1 arguments for the algorithm `BR_IF` ...")); }
let __p444 = args[0].clone();
v_l = __p444.clone();
// Assert (top_value(I32))
if !rt::is_true(&Value::Bool(cx.value_stack_len() > 0)) { return err("assertion fail: ..."); }
// Pop (I32.CONST c)
let __x445 = cx.pop_value()?;
let __a446: Rc<[Value]> = match &__x445 {
Value::Case(t, a) if *t == Tag(2) && a.len() == 2 => a.clone(), // CONST
_ => { return err(format!("invalid assignment: on rhs {}", __x445)); } };
let __x447 = __a446[0].clone();
let __a448: Rc<[Value]> = match &__x447 {
Value::Case(t, a) if *t == Tag(3) && a.len() == 0 => a.clone(), // I32
_ => { return err(format!("invalid assignment: on rhs {}", __x447)); } };
let __x449 = __a446[1].clone();
v_c = __x449.clone();
// If ((c =/= 0)) { Execute (BR l) } Else { Nop }
if rt::is_true(&rt::ne(&v_c.clone(), &Value::Num(Num::Nat(Z::S(0i128))))?) {
let __v450 = Value::Case(Tag(21), Rc::new([v_l.clone()])); // BR l
cx.execute(__v450)?;
} else {
}
Ok(None)
}
The short version
On top is the spec's rule for br_if: check there's a value, pop it, and if it isn't zero, branch. Below is the Rust my compiler generated. Each gray comment is one line of the spec, and the code under it is its translation, so anyone can check it line by line. It's wordy on purpose: this first version is a literal translation, and the speed came later from separate, tested rewrites.
How to read it, line by line
| Spec line | Rust | In plain words |
|---|---|---|
Step_pure/br_if l | pub fn r_BR_IF, let mut v_c, let mut v_l | One Rust function per spec algorithm, and one Rust variable per spec variable (c and l). This replaces the interpreter's lookup table of variables. |
(the argument l) | if args.len() != 1, v_l = __p444.clone() | Check exactly one argument came in, and call it l: the label to jump to. |
Assert (top_value(I32)) | cx.value_stack_len() > 0 | There must be a value on the stack. |
Pop (I32.CONST c) | cx.pop_value() and the two match blocks | Take the value off. The first match checks it's a CONST (tag 2) with two parts, the second checks the first part is I32 (tag 3). The number inside becomes c. A wrong shape stops with an error instead of guessing. |
If ((c =/= 0)) { Execute (BR l) } | rt::ne(&v_c, .. 0 ..), Value::Case(Tag(21), ..), cx.execute | If c isn't zero, build the instruction BR l (tag 21) and run it. |
Else { Nop } | empty else, Ok(None) | Otherwise do nothing. Done. |
Common questions
Why is it so wordy, with all the .clone()s?
On purpose. The first version is a literal translation so it's easy to check against the spec. Speed came afterwards, from separate rewrites, each tested on the full suite (Table 3).
What are __p444 and __x445?
Temporary names the compiler invents. The number just keeps them unique.
Why are the names numbers (tags 2, 3, 21)?
Names like CONST, I32 and BR become small numbers when the code is generated, so at run time comparing them is comparing two integers, not two words.
The spec says the top value must be an I32, but the code only checks the stack isn't empty.
Deliberate. SpecTec's own meta-interpreter does exactly the same (its source has a "TODO: type check" there), and Lockstep mirrors it. The very next line's match would still catch a wrong type and stop with an error, and WebAssembly's validation guarantees the type anyway.
What's Z::S(0i128)?
The number 0 as the spec's mathematical integer. The spec uses unbounded numbers; small ones are stored in a 128-bit integer.
Table 3. The seven rewrites
| Variant | Change | Why the meaning is unchanged |
|---|---|---|
| v0 | literal translation (baseline) | mirrors the meta-interpreter |
| v1 slices | arguments passed as a borrowed slice, not a new Vec per call | callees only read their arguments |
| v2 numerics | numeric builtins called directly, not through a string match | one macro table generates both forms, so they cannot drift apart |
| v3 shared seq | entering a block shares its instruction list and keeps a cursor, instead of copying it | the spec never mutates an instruction list in place: every in-place update targets the store, a frame's locals or a module instance |
| v4 cases | nullary constructors share one empty argument array; others allocate once instead of twice | argument arrays are immutable |
| v5 memo | a pure helper called twice with the same arguments is called once | a purity analysis over all 474 algorithms (fixpoint): no state reads, no in-place updates, only pure callees, and every argument variable bound once |
| v6 tests | type tests by constructor tag (cached) instead of comparing name strings; equality with a nullary constructor becomes a tag check (161 sites) | tags are in one-to-one correspondence with names |
| v7 bytes | byte memories stored as a byte vector instead of one boxed value per byte | only five runtime operations see the new form; any other use fails loudly instead of silently |
The short version
These are the seven speed-ups. The last column is the reason each one can't change any result, and after each one I re-ran all 55,861 tests. Most of them remove wasted memory work, like using a bookmark instead of copying a list of instructions, or not computing the same pure result twice.
How to read it, in plain words
- v0: the literal translation, the starting point.
- v1: hand over a function's arguments directly instead of packing them into a new list on every call.
- v2: call math functions directly instead of looking them up by name.
- v3: use a bookmark into a block's instruction list instead of copying the whole list.
- v4: share one empty list for simple values, and build other values in one step instead of two.
- v5: don't compute the same pure result twice.
- v6: check a value's type by its number tag instead of comparing words.
- v7: store memory as plain bytes instead of one big general value per byte.
Common questions
Which one is the cleverest?
v5. The compiler checks all 474 algorithms to find the "pure" ones: same input always gives the same output, no side effects. It repeats the check until nothing changes, since an algorithm is only pure if everything it calls is pure. Then it reuses results instead of recomputing them. For example, the spec's arithmetic rule calls $binop_ twice per instruction (once to check for a trap, once to get the result); now it's called once. Thirty algorithms get this.
Which one was the riskiest?
v3, because its safety depends on a fact about the whole spec: nothing ever changes an instruction list in place. Every in-place change in the generated code was checked: they all target the store, a frame's local variables or a module instance, never an instruction list.
How do you know they didn't break anything?
Two layers. Each rewrite has a reason it can't change behaviour (the last column), and each version was re-run on the complete official suite: all of them give identical results in all 259 files (Table 4).
Table 4. Correctness on the official test suite
| System | Files | Commands passed | Pass rate | Per-file result |
|---|---|---|---|---|
| SpecTec meta-interpreter | 259 | 55,861 / 55,861 | 100% | reference |
| Lockstep v0 (literal) | 259 | 55,861 / 55,861 | 100% | identical in 259 / 259 |
| Lockstep v1 to v7 (each) | 259 | 55,861 / 55,861 | 100% | identical in 259 / 259 |
The short version
This is the correctness result. SpecTec passes 55,861 commands on the official test suite, and so does my engine. And it's not just the same total: it's the same result in every one of the 259 files, for the first version and for each of the seven optimized versions.
How to read it
- A "command" is one check inside a test file, like "calling add(2, 3) must return 5" or "dividing by zero must trap".
- The last column is the strong part: results were compared file by file, not just as one total.
- The third row is seven separate versions, each run on the whole suite.
Common questions
Why not every command in the suite?
To compare fairly, Lockstep counts with SpecTec's own runner rules. Those skip 11 very slow test names (12 files, because memory_grow exists twice) and command kinds that test the parser rather than execution, like assert_malformed. Both systems skip exactly the same things.
Does passing the tests prove it's correct?
It's strong evidence, not a proof. And because Lockstep mirrors the meta-interpreter, a bug both share wouldn't show up. The paper lists this as a limitation.
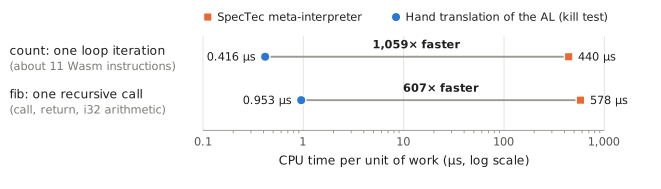
Figure 2. The kill test
The short version
Before building the full compiler, I ran a one-week test. I translated about 15 instructions by hand, following the spec exactly, and set two rules in advance: stop if more than 3 instructions needed logic that isn't in the spec, or if it was less than 10 times faster. Zero instructions needed extra logic, and it was 600 to 1,000 times faster, so I went ahead.
How to read it
- Two rows, two tests. count: one loop iteration (about 11 Wasm instructions). fib: one recursive call.
- Orange square = SpecTec's meta-interpreter. Blue dot = the hand translation.
- The axis is CPU time per unit of work in microseconds (millionths of a second), log scale. Left = less time = faster.
- count: 440 µs vs 0.416 µs, 1,059× faster. fib: 578 µs vs 0.953 µs, 607× faster. The dots are about three grid lines apart, and three grid lines is 10 × 10 × 10 = 1,000×.
Common questions
If this was 1,000× faster, why is the real engine only 28 to 45×?
The hand translation used plain Rust integers for just 15 instructions. The real engine handles the whole language, so it uses one general value type for everything (numbers, lists, records, instructions), and that costs much more. Closing that gap is what the rewrites in Table 3 work on.
Why is it called a kill test?
It was designed to kill the project early if the idea didn't work, before months of effort. The rules were fixed in advance so the goalposts couldn't move.
Did anything have to be invented?
Only shared runtime code taken from the meta-interpreter's OCaml: the context stack, the run loop, the "finish before the next statement" rule and math integers as 128-bit numbers. About 170 lines, and none of it specific to one instruction.
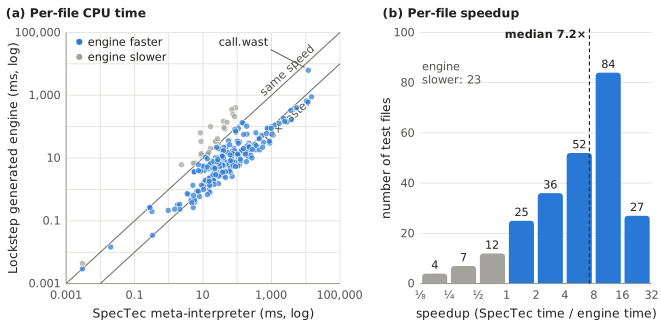
Figure 4. The whole test suite, file by file
The short version
This is the whole official test suite, file by file. On the left, each dot is a file, and dots below the diagonal ran faster on my engine. On the right you can see how many files fall in each speedup range: most are 4 to 16 times faster, and the median is 7.2 times. The 23 gray files that were slower are mostly memory tests, and that's exactly what the last rewrite, v7, fixed.
How to read (a), the scatter plot
- Each dot is one test file (247 files; the 12 skipped long tests are left out). Across is SpecTec's CPU time for that file, up is Lockstep's, both log scale in milliseconds.
- The diagonal marked "same speed": a dot on it took the same time on both. Below it = Lockstep faster. Above it = Lockstep slower.
- The second, lower diagonal marks 10× faster. Dots under it gained more than 10×.
- Bottom left are tiny files, top right are big ones.
call.wastis labelled because v0 used 2.84 GB of memory on it.
How to read (b), the bar chart
- Each bar counts the files whose speedup falls in a range. The ranges double each step (1/8 to 1/4, 1/4 to 1/2, ... 16 to 32).
- Gray bars, left of 1: Lockstep was slower. 4 + 7 + 12 = 23 files.
- Blue bars: faster. 25 files at 1 to 2×, 36 at 2 to 4×, 52 at 4 to 8×, 84 at 8 to 16× (the tallest), 27 at 16 to 32×.
- The dashed line is the median, 7.2×: half the files gained more than that, half less.
- For the whole suite: SpecTec needed 108.4 s of CPU time, Lockstep 16.0 s. That's 6.8× faster.
Common questions
Why are 23 files slower?
In v0, memory was stored as one big general value per byte, so tests that grow memory were slow and memory-hungry. call.wast grows memory by 306 pages and v0 peaked at 2.84 GB there. v7 stores plain bytes and the peak dropped to 35 MB, 81× less. To be honest about it: the timings in this figure are v0; the suite hasn't been re-timed with v7 yet.
Why only 6.8× here but 28× on the kernels?
Test files are tiny, so loading and setting up each module takes most of the time. The kernels are loops doing real work, which is where compiling helps most. Test files that compute more, like several SIMD tests, reach 20 to 30×.
Median 7.2×, but the paper also says geometric mean 5.1×?
The median is the middle file. The geometric mean averages all of them, so the 23 slow memory files pull it down. The full range is 0.13× to 30×.
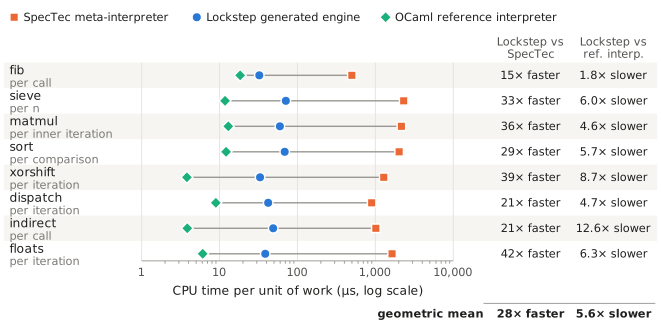
Figure 3. Compute kernels: the main speed result
The short version
This is the main speed result, on eight benchmark programs. Orange is SpecTec, blue is my engine, green is the hand-written reference interpreter, and further left means faster. In every row my engine is in the middle: 15 to 42 times faster than SpecTec, 28 times on average, but still slower than the hand-written interpreter. And this is the first version, before any optimization.
How to read it
- Each row is one benchmark ("kernel"), with its unit of work under the name: per call, per iteration, and so on.
- Orange square = SpecTec's meta-interpreter. Blue dot = Lockstep v0. Green diamond = the official OCaml reference interpreter, written by hand.
- The axis is CPU time per unit of work in microseconds, log scale. Left = faster.
- The two columns on the right are the ratios for Lockstep: how many times faster than SpecTec, and how many times slower than the reference.
- The bottom row is the geometric mean: 28× faster than SpecTec, 5.6× slower than the reference.
- The gap between orange and green shows how slow running the spec directly is: the meta-interpreter is 27 to 336× slower than the reference interpreter.
What the eight kernels are
- fib: recursive Fibonacci, lots of function calls. sieve: finding primes in memory. matmul: matrix multiplication. sort: bubble sort.
- xorshift: a random number generator, bit math. dispatch: a jump table (
br_table). indirect: calls through a function table. floats: decimal (floating-point) math.
Common questions
How did you measure fairly?
CPU time measured inside each program, with SpecTec's spec loading excluded. Each kernel ran at 3 sizes, 5 runs each, median taken, and the slope method gives the cost per unit. All three engines were measured in the same session.
Why is indirect the worst (12.6× slower)?
Indirect calls go through a type check and a table lookup that the spec describes in many small steps. It's next on the list of rewrites.
Isn't being 5.6× slower than the reference bad?
That's v0, before any optimization. After the seven rewrites it's about 3.5× (Table 5), and on fib only 1.2×. Getting within 2× was a stretch goal, and it isn't met yet. The paper says so.
Table 5. The kernels in numbers, plus the final version
| Kernel (unit) | SpecTec | Lockstep v0 | Ref. interp. | v0 faster than SpecTec | v0 slower than ref. | Lockstep v7 | v7 faster than SpecTec | v7 slower than ref. |
|---|---|---|---|---|---|---|---|---|
| fib (call) | 499.1 | 32.4 | 18.4 | 15× | 1.8× | 22.9 | 22× | 1.2× |
| sieve (n) | 2,310.8 | 71.0 | 11.8 | 33× | 6.0× | 51.6 | 45× | 4.4× |
| matmul (inner iteration) | 2,161.9 | 59.5 | 12.9 | 36× | 4.6× | 38.7 | 56× | 3.0× |
| sort (comparison) | 2,021.1 | 68.6 | 12.1 | 29× | 5.7× | 43.7 | 46× | 3.6× |
| xorshift (iteration) | 1,280.3 | 33.1 | 3.8 | 39× | 8.7× | 15.9 | 80× | 4.2× |
| dispatch (iteration) | 896.1 | 42.1 | 9.0 | 21× | 4.7× | 23.7 | 38× | 2.6× |
| indirect (call) | 1,014.4 | 48.7 | 3.9 | 21× | 12.6× | 35.5 | 29× | 9.2× |
| floats (iteration) | 1,637.3 | 38.6 | 6.1 | 42× | 6.3× | 22.2 | 74× | 3.7× |
| geometric mean | 28× | 5.6× | ~45× | ~3.5× |
The short version
These are the exact numbers behind that chart, plus the final version, v7. After the seven rewrites, my engine went from 28 to about 45 times faster than SpecTec, and from 5.6 to about 3.5 times behind the hand-written interpreter. On fib it's almost there, only 1.2 times slower. The v7 numbers are approximate, because they combine two measuring sessions.
How to read it
- Columns 2 to 4: microseconds per unit for each engine.
- Columns 5 and 6 are just divisions. fib: 499.1 ÷ 32.4 = 15× faster than SpecTec, and 32.4 ÷ 18.4 = 1.8× slower than the reference.
- Columns 7 to 9 do the same for v7. xorshift: 1,280.3 ÷ 15.9 = 80× faster than SpecTec.
- The "~" on the bottom row means approximate.
Common questions
Why the "~" on 45× and 3.5×?
v7 was timed in a different session (the ablation run) from SpecTec and the reference interpreter, and the server was busy. So those two numbers mix sessions and are approximate. The caption says so.
Did you reach your goals?
At least 10× faster than SpecTec: yes, 28× already at v0 and about 45× at v7. Within 2× of the hand-written reference (stretch goal): not yet, about 3.5× overall, though fib is already at 1.2×.
Figure 5. Ablation: what each rewrite contributes
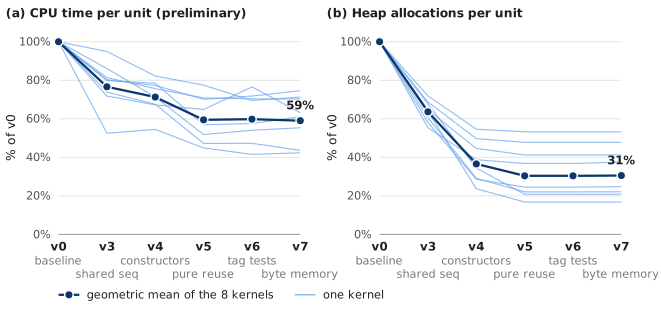
The short version
This shows what the rewrites did, one at a time. The right side counts memory allocations, which are exact: they fell to 31% of the start. The left side is time, which is noisier because the server was busy, but it follows the same shape and ends at 59%, which means 1.69 times faster. The benchmarks that lost the most allocations sped up the most, so allocation was the main cost.
How to read it
- Across: the versions in order. v0 baseline, v3 shared seq, v4 constructors, v5 pure reuse, v6 tag tests, v7 byte memory. v1 and v2 weren't timed in this run, so the first step (v0 to v3) contains three rewrites: v1, v2 and v3.
- Up: percent of v0. 100% means the same as the start.
- Thin light lines = the eight kernels, one line each. Thick dark line with big dots = their geometric mean.
- (a) Time ends at 59% of v0, which is 1.69× faster. It's bumpy because of the busy server: one thin line jumps up at v6 (fib, 23.5 to 27.8 µs), but its allocation count didn't change, so that's noise.
- (b) Allocations end at 31%: about 70% removed. It's smooth because allocation counts are exact.
- Where the drops are: for allocations, the v0-to-v3 step and v4; for time, the v0-to-v3 step and v5. After v5 both charts go flat: v6 and v7 didn't change these kernels.
What's an allocation?
Every time the program asks for a fresh piece of memory to hold a value, and later gives it back. v0 did 200 to 450 of these per unit of work. It's like fetching a new box from the warehouse for every item instead of reusing the one you have: each trip is quick, but hundreds of trips per step add up.
Common questions
Why measure allocations at all?
Because the timings were noisy on a shared server. Allocation counts don't change with machine load, so they're solid evidence even when the times aren't.
So v6 and v7 were useless?
No. v6 showed that comparing names wasn't the bottleneck, which is a real finding. v7 was about memory size, not speed: call.wast went from 2.84 GB to 35 MB. These kernels barely use memory, so it can't show here.
Where are v1 and v2?
In an earlier run: v1 was 1.18×, v2 1.11× and v3 1.18× faster than v0. v2 looking slower than v1 is noise, since their allocation counts are identical; v2 doesn't change allocations at all.
Table 6. The ablation in numbers
| Kernel | v0 | v3 | v4 | v5 | v6 | v7 | v7 vs v0 |
|---|---|---|---|---|---|---|---|
| fib | 36.3 (217) | 26.1 (156) | 24.4 (118) | 23.5 (115) | 27.8 (115) | 22.9 (115) | 1.58× |
| sieve | 69.2 (415) | 55.5 (230) | 53.5 (161) | 48.5 (153) | 49.7 (153) | 51.6 (156) | 1.34× |
| matmul | 91.4 (443) | 48.0 (268) | 49.8 (129) | 41.0 (98) | 37.9 (98) | 38.7 (98) | 2.36× |
| sort | 61.3 (379) | 58.2 (220) | 50.4 (108) | 47.5 (93) | 42.6 (93) | 43.7 (94) | 1.40× |
| xorshift | 36.5 (304) | 27.0 (194) | 24.7 (72) | 17.2 (51) | 17.3 (51) | 15.9 (51) | 2.29× |
| dispatch | 38.8 (309) | 31.0 (200) | 30.4 (138) | 22.1 (127) | 22.3 (127) | 23.7 (127) | 1.64× |
| indirect | 50.5 (316) | 41.1 (217) | 38.2 (157) | 35.8 (151) | 35.5 (151) | 35.5 (151) | 1.42× |
| floats | 40.2 (456) | 34.6 (309) | 28.6 (157) | 20.8 (95) | 21.7 (95) | 22.2 (95) | 1.81× |
| geomean speedup vs v0 | 1.00× | 1.31× | 1.40× | 1.68× | 1.67× | 1.69× |
The short version
These are the numbers behind that chart. Each cell is the time, with the allocations in brackets. For example, xorshift went from 304 allocations per step to 51, and its time dropped by more than half. Overall, the seven rewrites made the engine 1.69 times faster: from 1.34 times on sieve up to 2.36 times on matmul.
How to read it
- Read a row left to right to follow one kernel through the versions. xorshift: 36.5 µs with 304 allocations at v0, 15.9 µs with 51 at v7.
- The last column is v0's time divided by v7's: 36.5 ÷ 15.9 = 2.29×.
- The bottom row is the average speedup over v0 at each version: 1.00, 1.31, 1.40, 1.68, 1.67, 1.69.
Common questions
Why does v6 sometimes look slower than v5 (fib 23.5 to 27.8)?
Noise from the busy server. The allocation count is identical (115 both times), so the work done didn't change.
matmul's v0 is 91.4 here but 59.5 in Table 5. Why?
Different sessions on a busy server. Run-to-run differences can be as big as the effects measured: v0's matmul was 58.0 µs in one ablation run and 91.4 µs in this one. That's why the paper calls the speed numbers preliminary and leans on the exact allocation counts. It also means matmul's 2.36× is probably on the high side.
The one-minute version
- Figure 1: the spec goes into my compiler and out comes a Rust engine; the official tests are compared file by file.
- Listing 1: the generated code follows the spec line by line, so it's easy to check.
- Figure 2: a one-week test proved it was worth doing first (600 to 1,000× on a small piece).
- Table 4: correctness: the same result as SpecTec in all 259 files, 55,861 commands, for every version.
- Figures 4 and 3: speed: 6.8× on the test suite, 28× on real loops, before any optimization.
- Figure 5: seven safe rewrites removed about 70% of allocations and gave another 1.69×, to about 45× in total.